

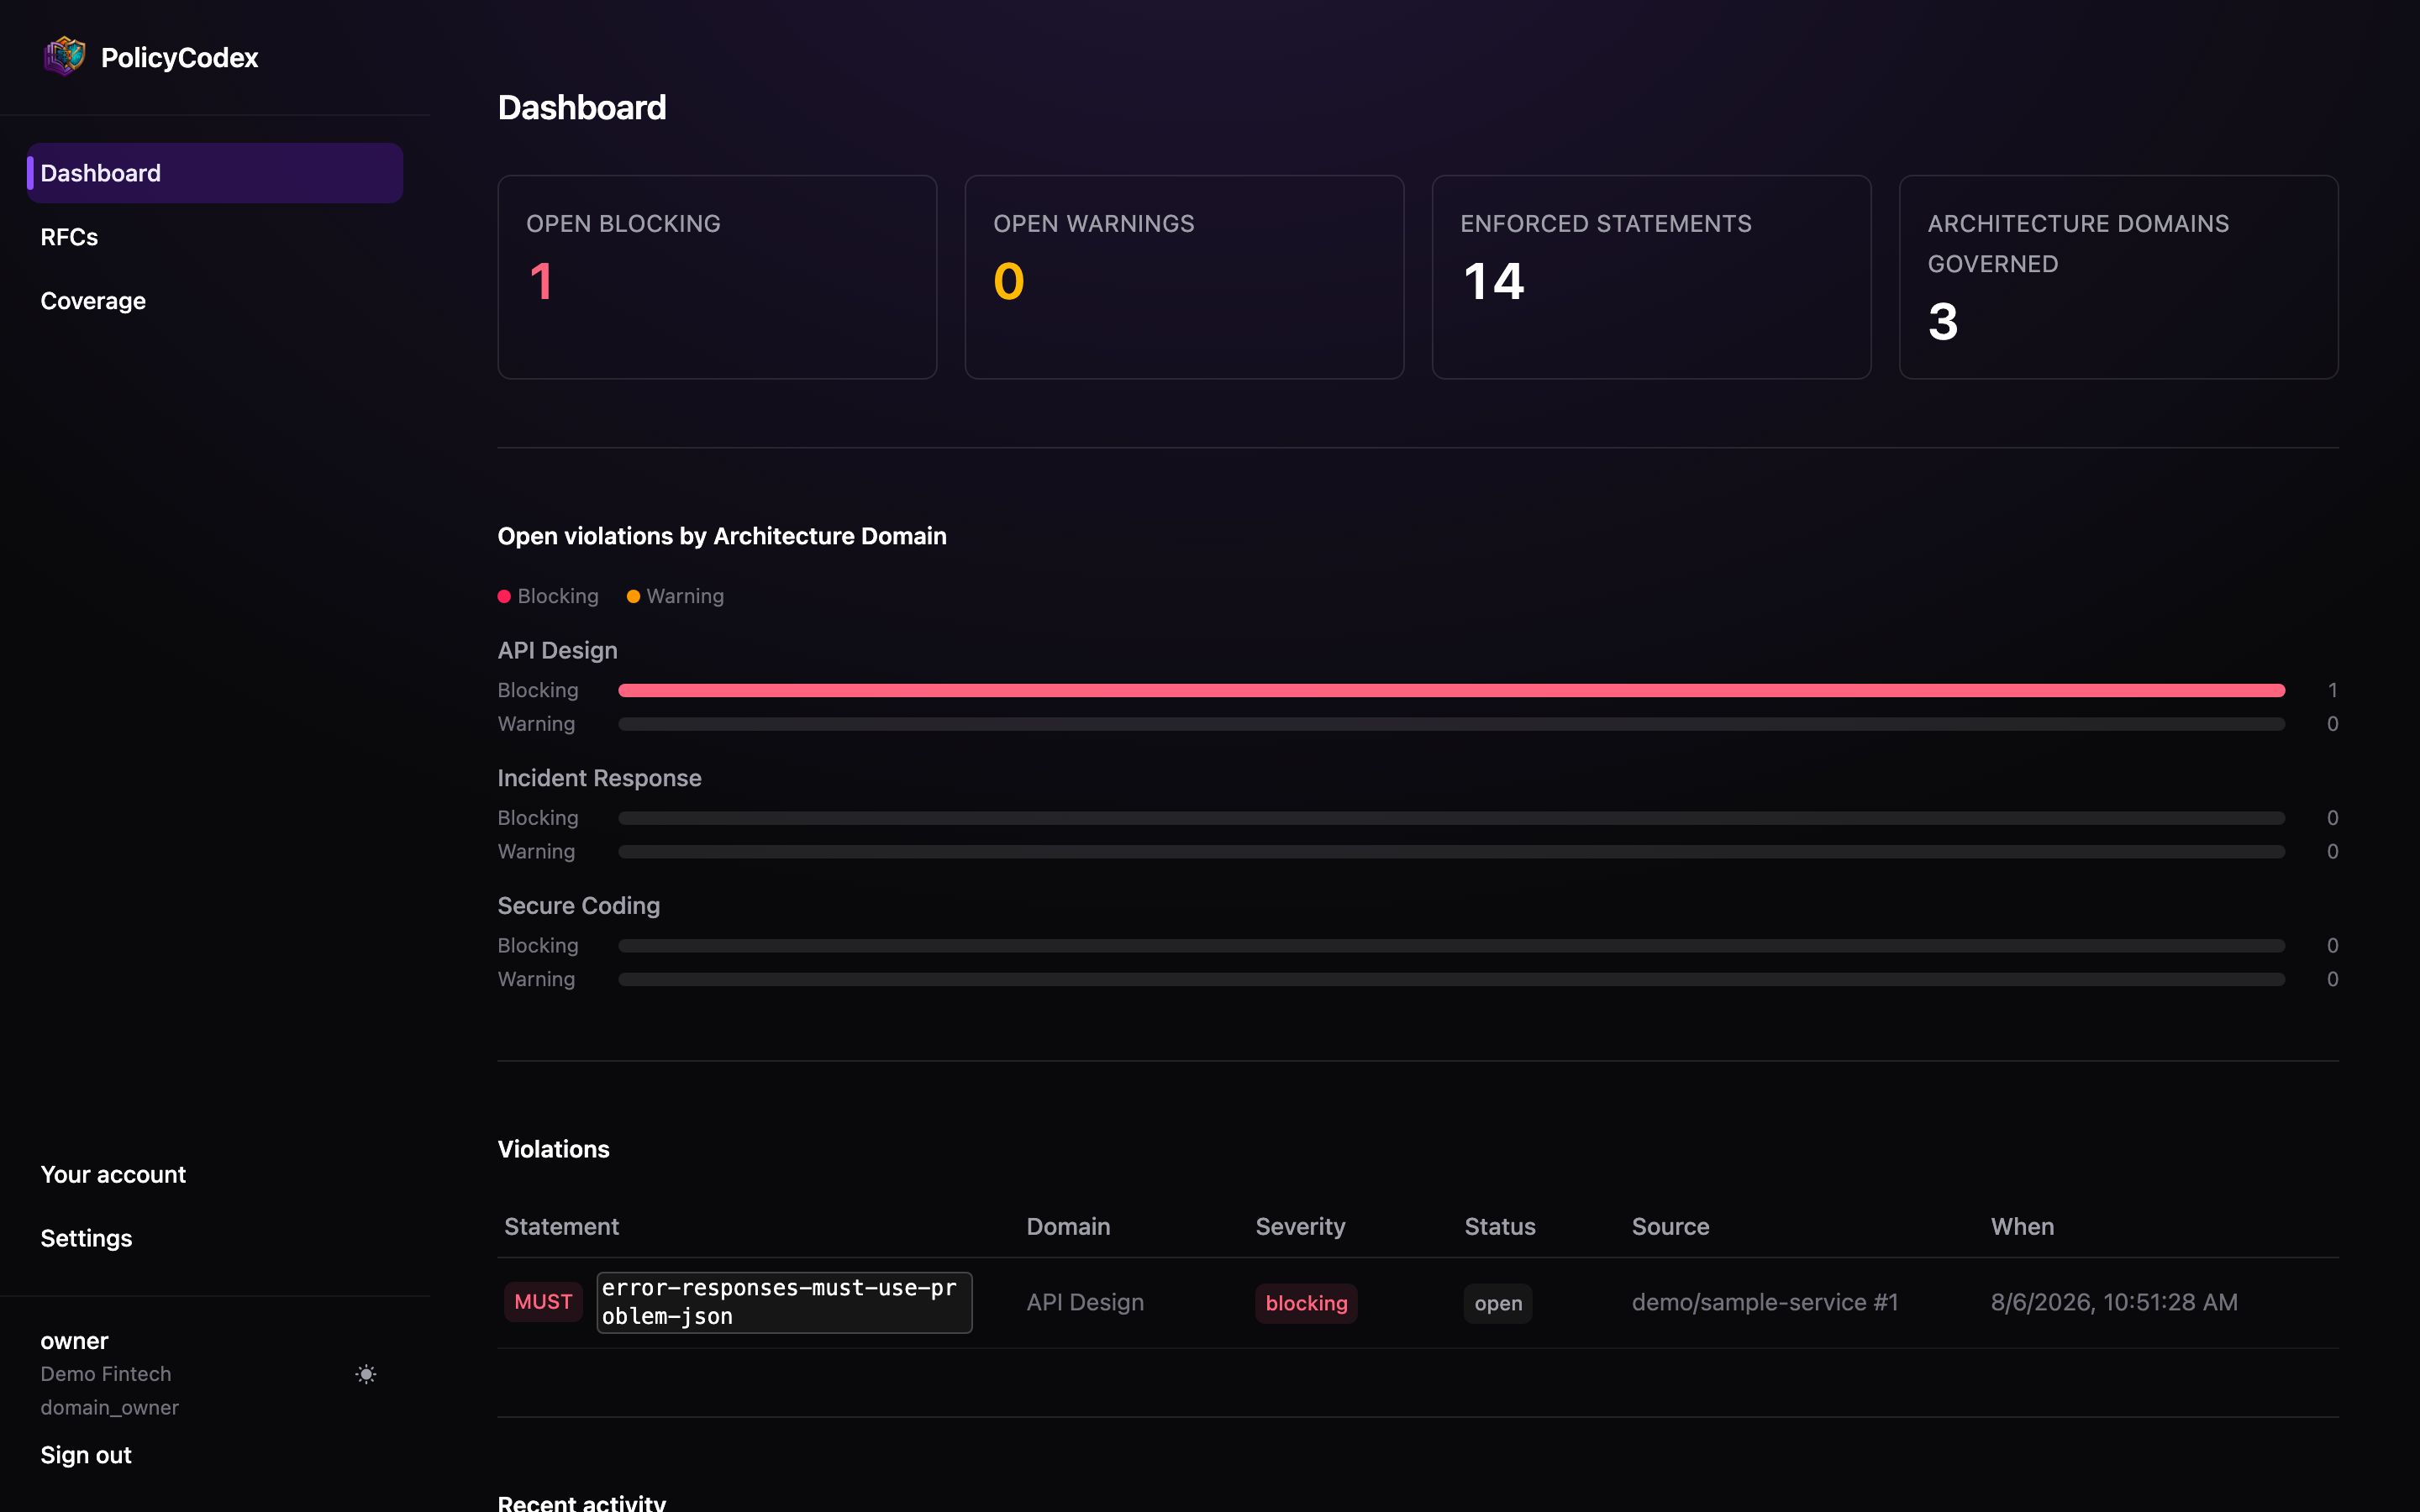
The tiles
Open blocking
Unresolved violations of enforced MUST statements. Each of these is failing a
check somewhere. This is the number to drive to zero.
Open warnings
Unresolved
SHOULD-level findings. Advisory — nothing is blocked, but a rising number
means a standard is being routinely ignored.Enforced statements
How many requirements are currently blocking. The size of your active rulebook.
Governed domains
How many architecture domains have standards in force.
The violations table
Every recorded violation, newest first — the flat, actionable list Reporting doesn’t have:
Because slugs are stable, this history stays coherent across RFC rewrites — a violation
from six months ago still resolves to the statement it cited.
Working the numbers
1
Blocking first
Open blocking violations are actively costing engineering time. Either fix the code or
— if the standard is wrong — revise the RFC.
2
Look for concentration
A single statement producing most findings is a signal about the statement, not the
teams. See which statements fail most in Reporting → RFC impact.
3
Check scope
A low violation count with only one repository reporting is not compliance. See
Reporting → Scope.
4
Then promote
Once a domain’s warnings are manageable, that domain’s approved RFCs are ready for
enforced.