

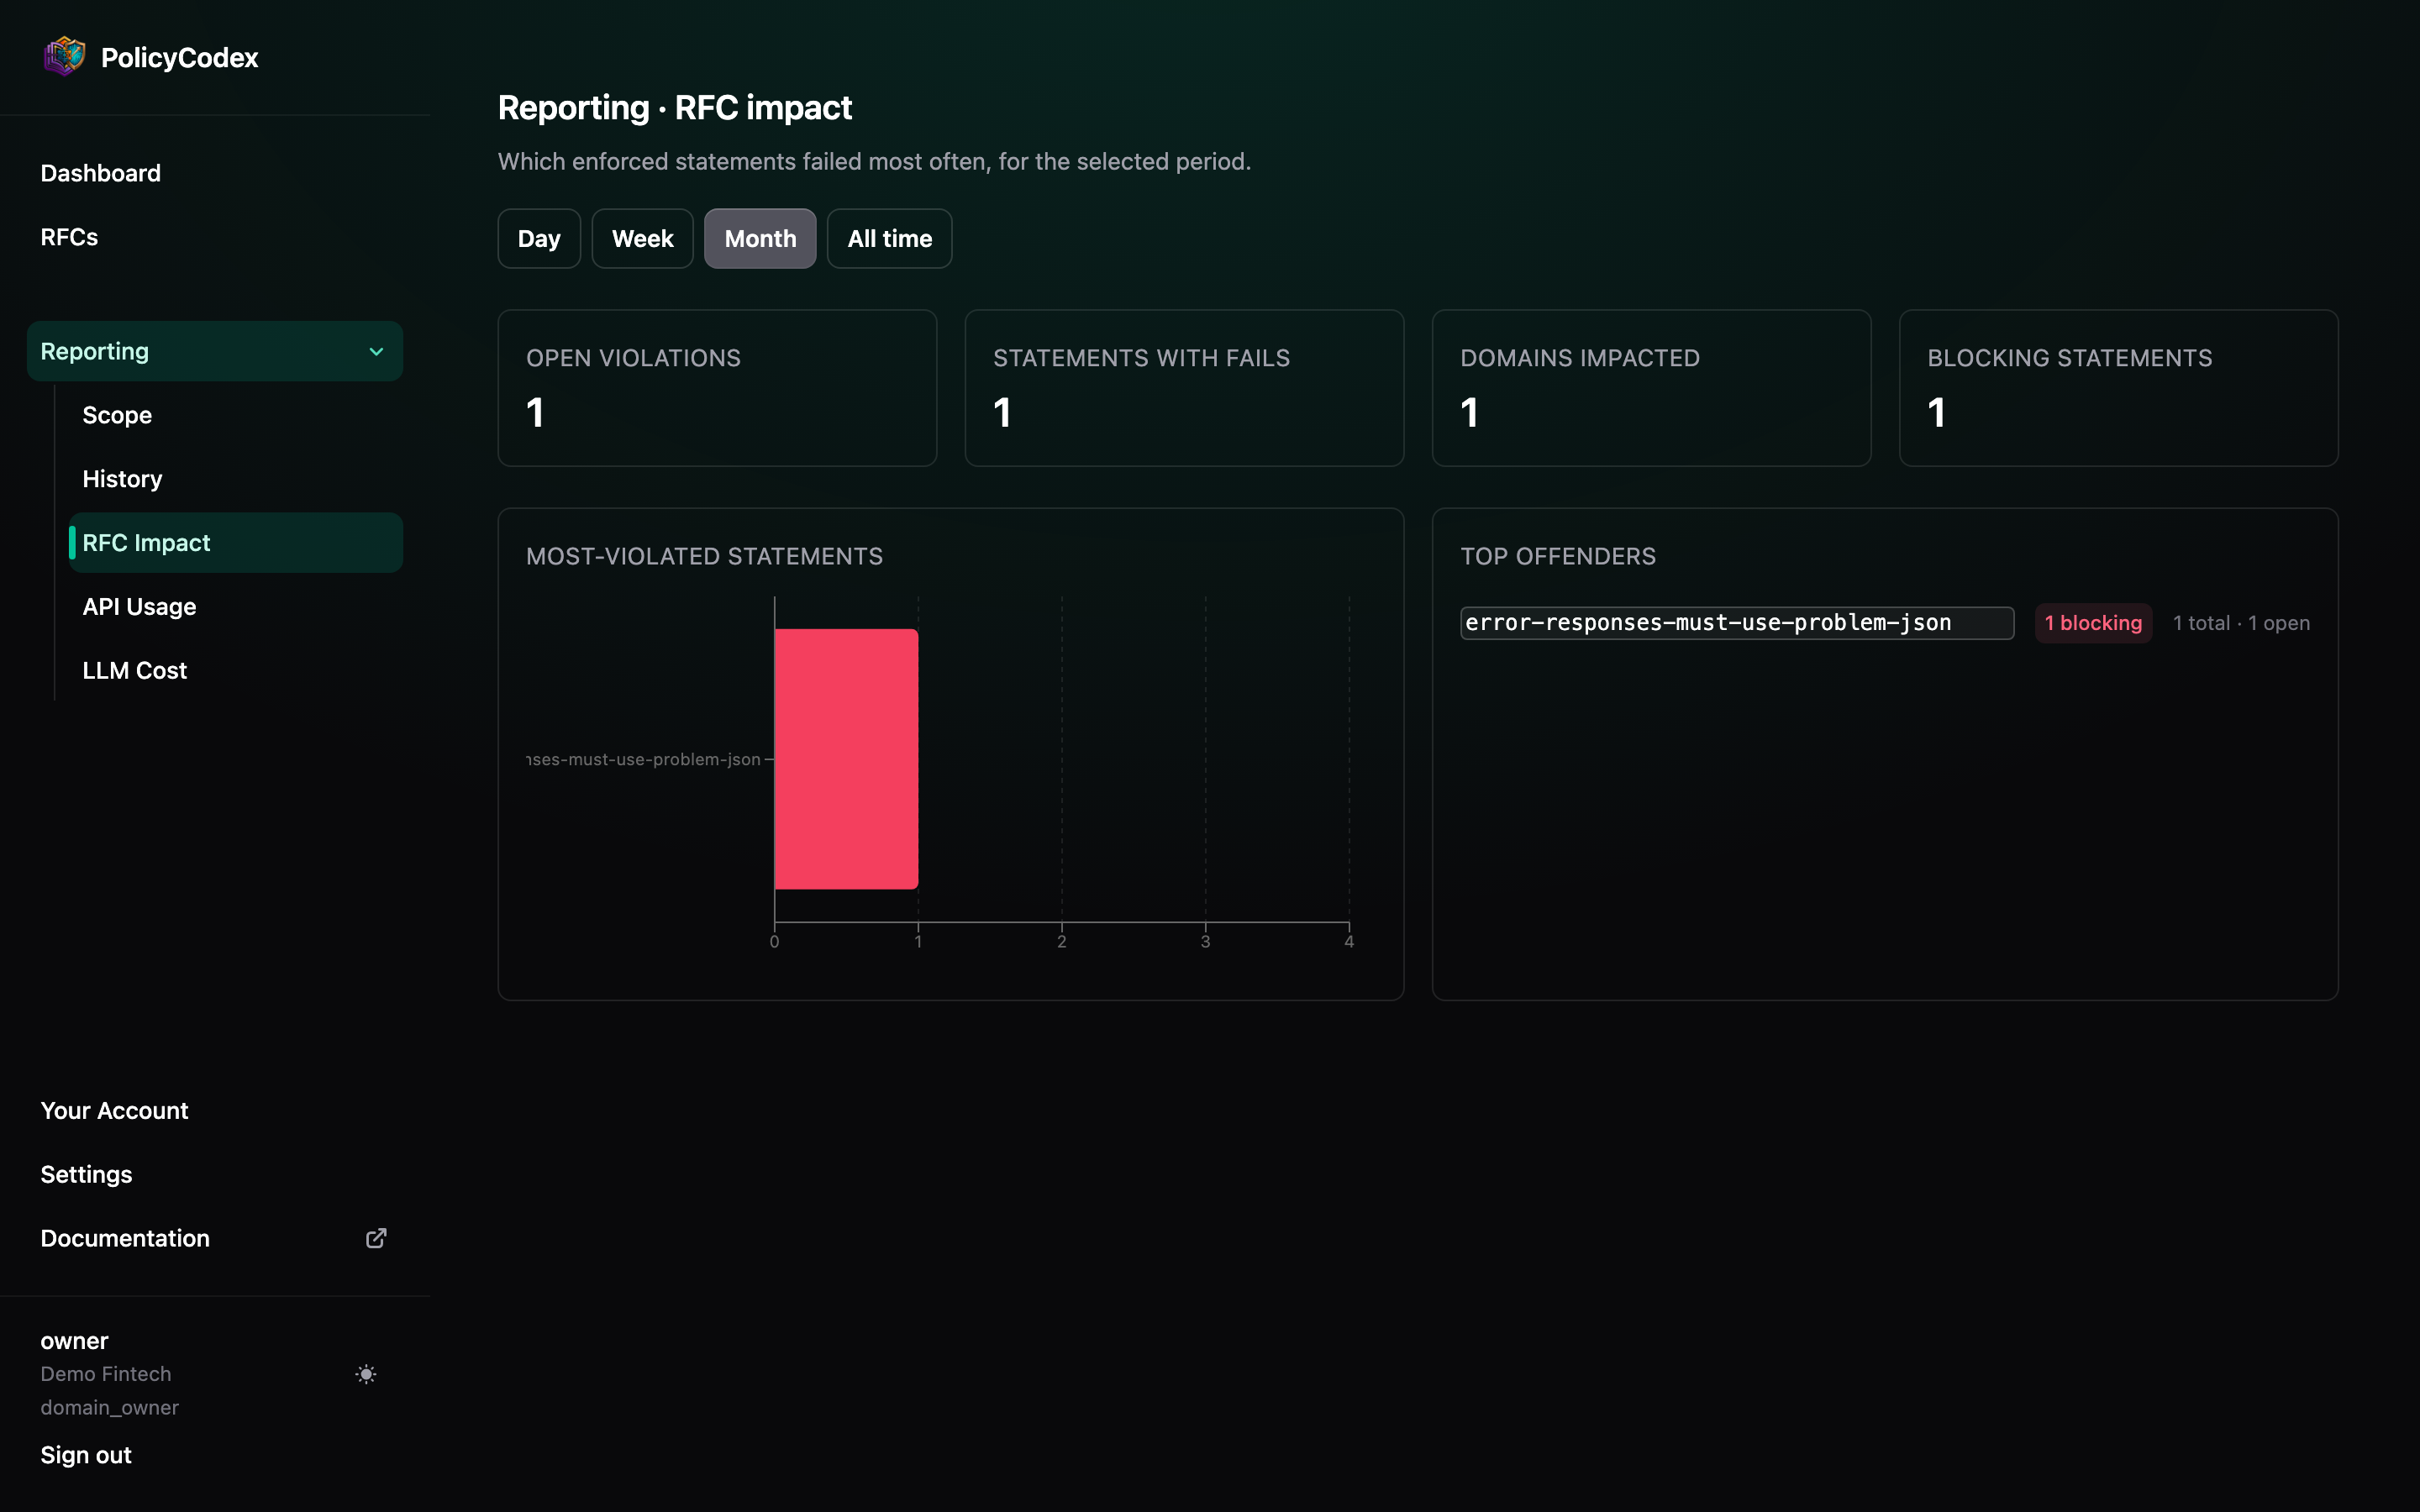
Stat tiles
All four scope to the period filter:Open violations
Currently-open violations among the ones raised in the selected window.
Statements with fails
How many distinct statements have at least one violation in the window — the size of
the problem, not the volume.
Domains impacted
How many architecture domains have at least one failing statement.
Blocking statements
Of the statements with fails, how many have at least one
blocking (MUST-level)
violation.Most-violated statements
A horizontal bar chart of violation counts by statement slug, red where the statement has at least one blocking violation and amber where every violation is advisory. Sorted worst-first — the top bar is where fixing one statement (or one over-broad rule) removes the most noise at once.Top offenders
The same ranking as a list, with slug, blocking count, and total/open counts per statement — useful when you want to click through to a statement’s RFC rather than just eyeball the chart.Reading it
A single statement producing most of an org’s findings is usually one of two things:- The RFC was promoted to
enforcedbefore the codebase caught up — expected, temporary noise that should trend down. - The statement itself is over-broad and firing on cases it shouldn’t — a signal to revise the statement, not chase every repository individually.