

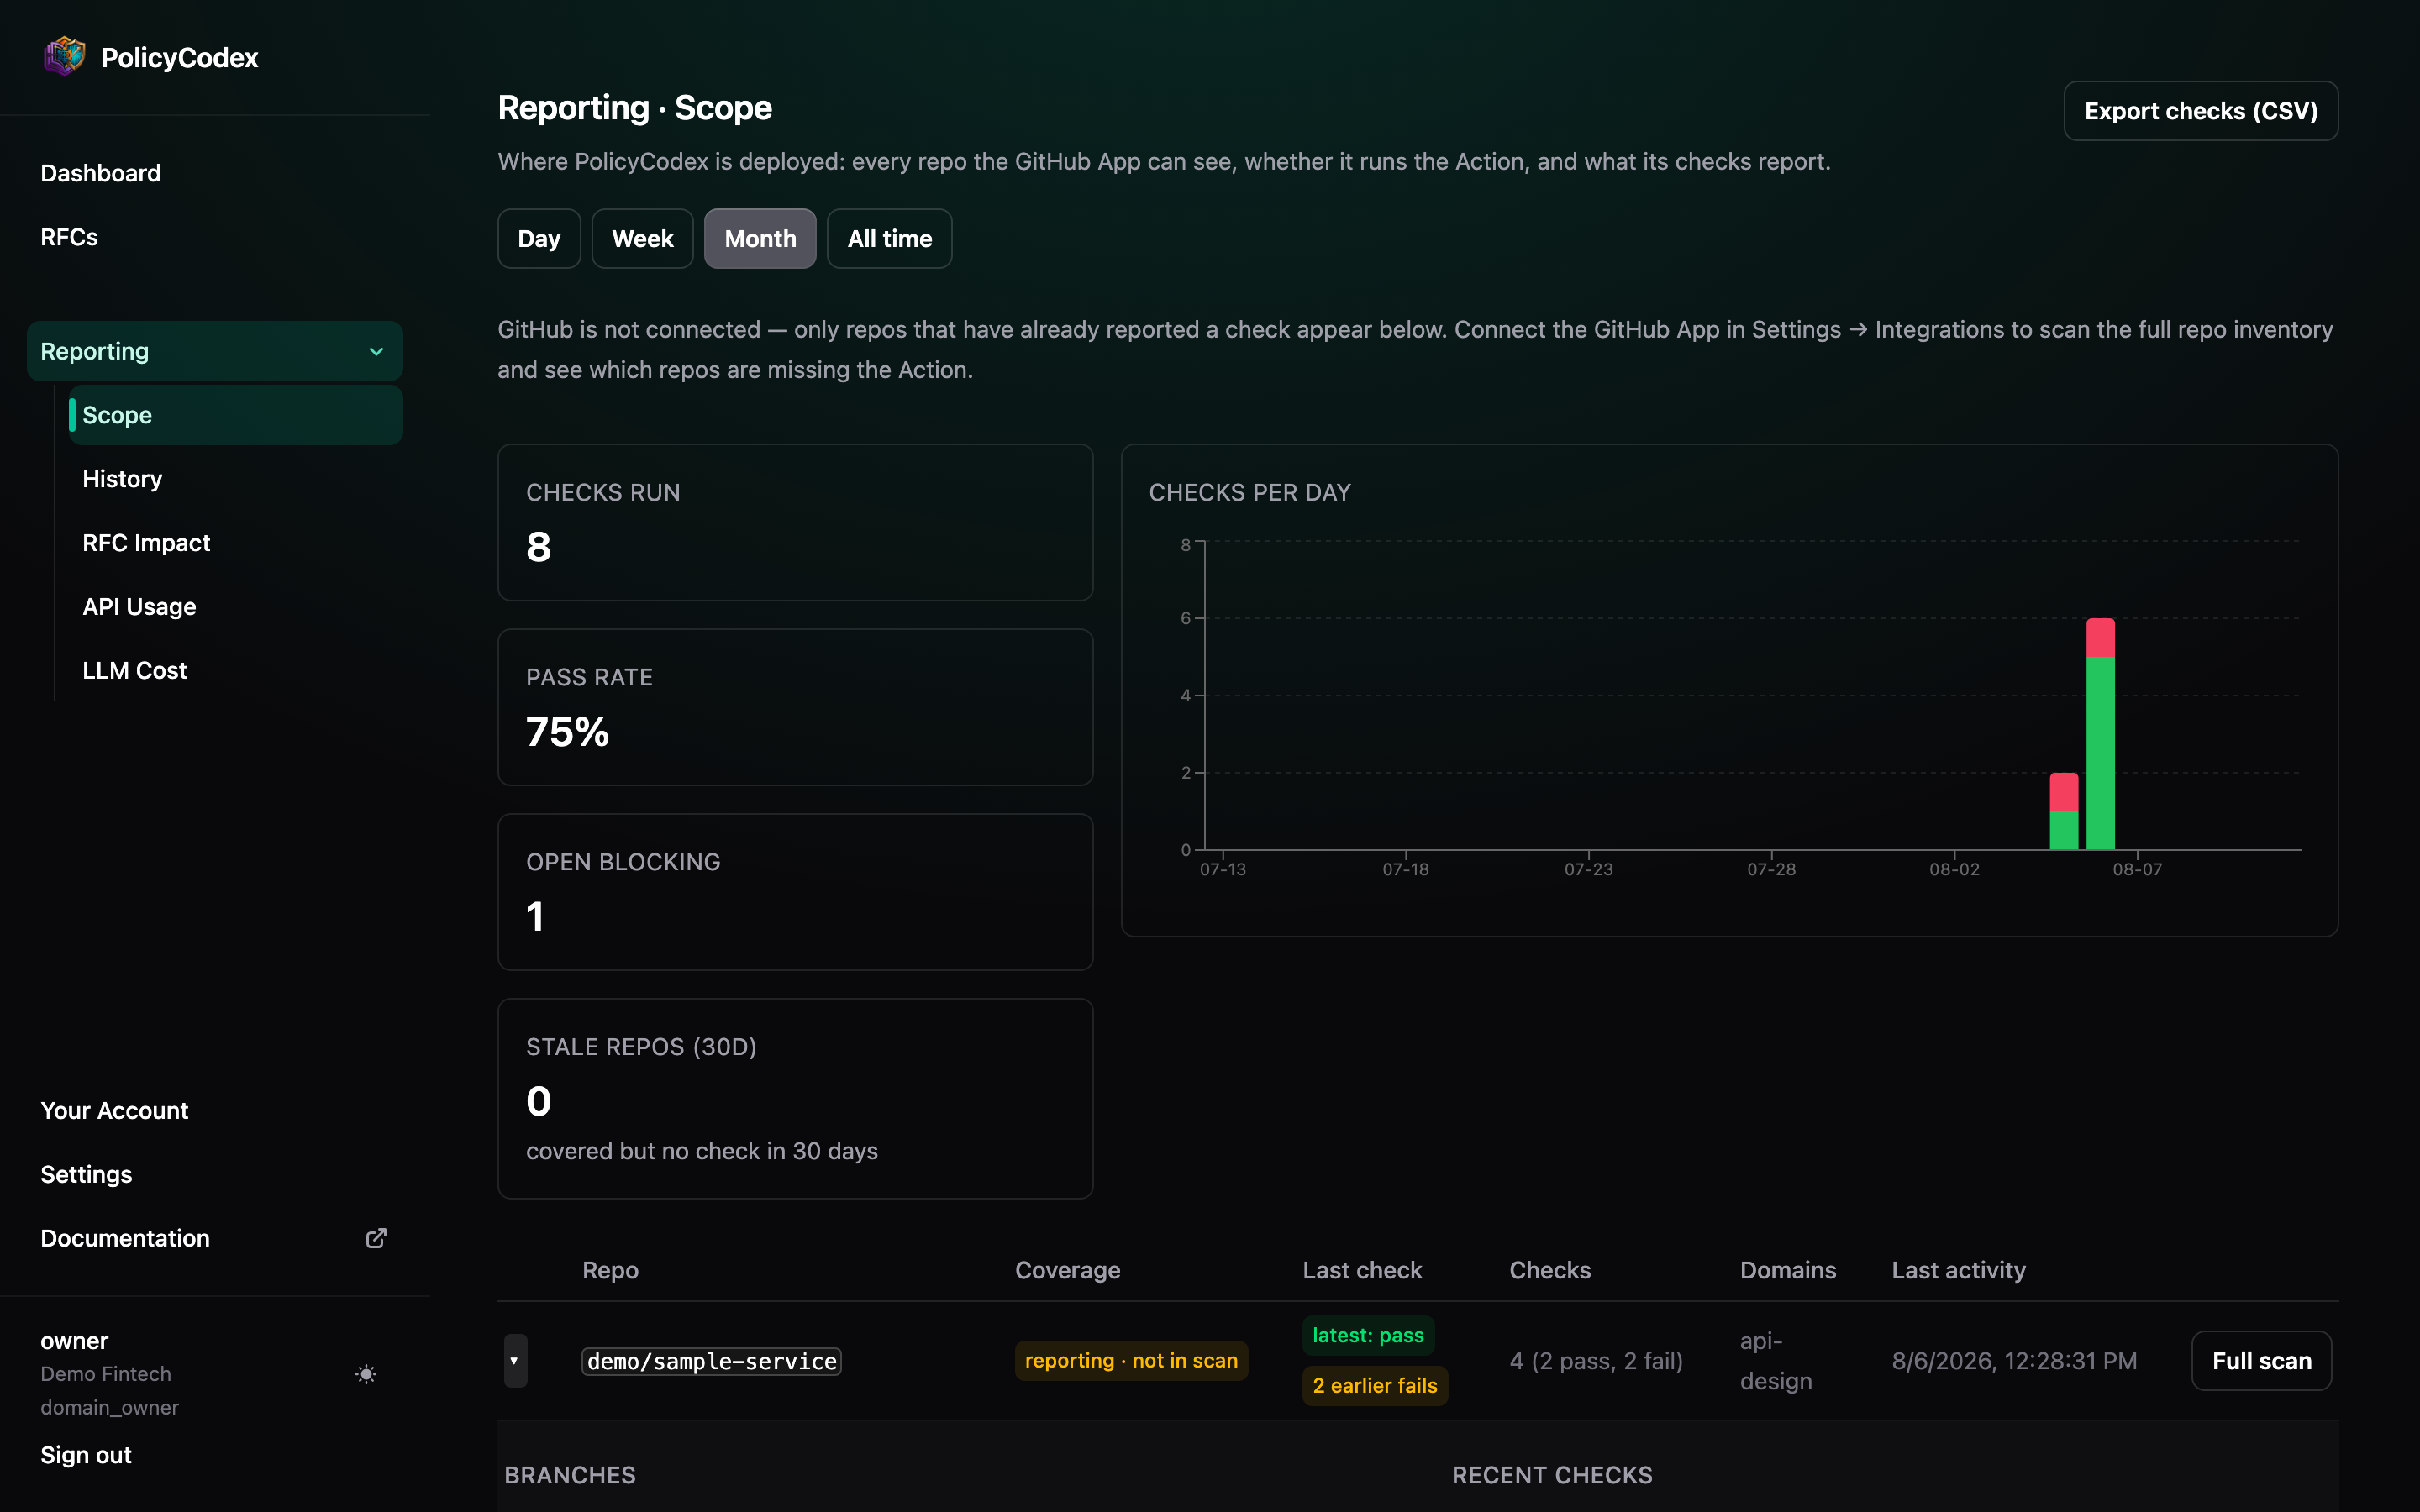
- The inventory — every repository the GitHub App can see, from the last scan (Rescan repos), with whether each one runs the Action workflow.
- Observed checks — every check actually run, whether by the App’s server-side runner, the Action, or a direct REST call.
Coverage states
Failing repositories sort to the top. The latest: pass / fail badge names what it
covers — the most recent check — and an amber “N earlier fails” appears when a green
latest sits on a failing history, so a repository never looks globally healthy on the
strength of one clean commit.
The drill-down
Expand any repository row for:- Branches — per-branch pass/fail counts, linked pull requests, and last activity.
Default-branch rows come from the App’s push checks: everything that lands on
maincarries a verdict, not just PRs. - Recent checks — the latest runs with their source (
app,actionorscan), result, blocking/warning counts, and how many statements were considered. - Open violations — the statement slugs currently open against the repository, triaged on the Dashboard.
Stat tiles
Scoped to the period filter: checks run, pass rate, and a per-day pass/fail chart. Two tiles are deliberately not scoped to the filter, because they’re current state rather than activity:- Open blocking — violations open right now, not just those raised in the selected window.
- Stale repos (30d) — covered repositories with no check in the last 30 days, always a fixed 30-day window regardless of the filter, so switching to “Day” doesn’t make every repo look stale.
The period filter
Day / Week / Month / All time, in the same position at the top of every Reporting page. It’s saved in your browser and carries over as you move between Scope, History, RFC impact, API usage and LLM cost — pick a window once, not five times.Extending scope
1
Connect the GitHub App
Install it on the organisation and select repositories.
Every selected repository is instantly covered by server-side PR and default-branch
checks — the fastest route from “not covered” to “enabled”.
2
Or add the Action per repository
Where you want repo-local configuration or your own compute, follow
GitHub Action. Both paths report here identically.
3
Rescan after changes
Rescan repos refreshes the inventory after installing, adding repositories to
the App, or adding workflows.
4
Watch the gaps, not the greens
The rows that matter are not covered and reporting · not in scan — the first
is unenforced estate, the second is enforcement you can’t see the extent of.